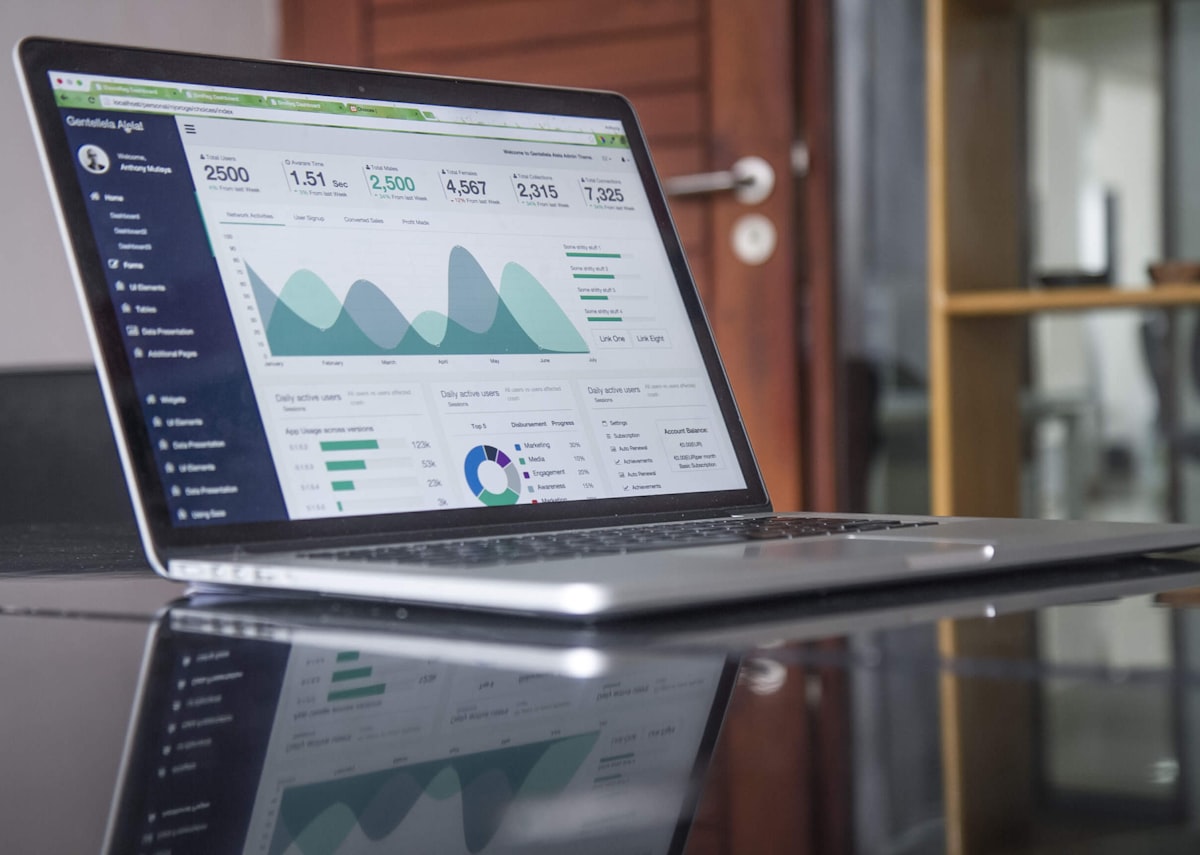
When people hear AI, most think of text: writing an email, summarizing a document, answering a question. That is no longer the full picture. Modern AI tools also produce visual output. They turn numbers in a table into a chart, assemble a report from data, and build a simple dashboard from a request.
For companies this is a practical shift. Reporting tends to be work nobody enjoys: export the data, paste it into a spreadsheet, make a chart, write a comment. That is exactly the routine AI can take over.
> Tip from KP Solutions: If your team regularly spends hours preparing the same charts and reports, that is an ideal first candidate for automation. Repetitive, predictable work with data is the easiest to automate.
From text to visual output
AI capabilities have grown. Beyond writing, tools today can create a chart from supplied data and pick a suitable type based on what you want to show, assemble a report that pairs numbers with a short written summary, prepare a process or relationship diagram from a text description, and put together a simple dashboard that updates when the data changes.
What matters is that this output comes from an ordinary request. You do not need to know analytics software. You just say clearly what you want to see and from which data.
What it means for reporting
A classic monthly report has a familiar life cycle: someone spends two days preparing it, management reads it in ten minutes, and nobody touches it until next month. The cost is high, the value short.
When AI prepares the report, the equation changes. Preparation takes minutes instead of hours, so the report does not have to be monthly. It can be weekly or on demand, whenever someone needs to decide.
| Aspect | Classic reporting | Reporting with AI |
|--------|-------------------|-------------------|
| Preparation | hours of manual work | minutes from data |
| Frequency | monthly, because it is costly | whenever needed |
| Consistency | depends on the person | same structure every time |
| Comment | written by hand | part of the output |
Faster and better decisions
The value is not the nice chart. It is that a decision no longer waits for the report. When a manager can ask "how did revenue go this week by branch" and shortly has both a chart and a summary, they do not wait until month end for what they could have known today.
This moves a company from deciding by gut feeling to deciding by data, without hiring an analytics team. Process automation meets reporting here: the data a company already collects can finally be used in time.
What to watch out for
An automated report is only as good as the data and the brief behind it. A few principles worth keeping: data must be clean and in one place, because mess on the input means mess on the output; the brief must clearly state what the report measures and who it is for; sensitive numbers need controlled access rather than a report open to anyone; and a person should review the output before an important decision, because AI prepares the basis while responsibility stays with people.
These rules are not a brake. They are the guardrails that make automated reporting something you can rely on.
Where to start in your company
You do not need to rebuild all reporting at once. A practical first step: pick one report you do regularly and repeatedly, check that its data is in one place and in order, describe exactly what the report should show and to whom, then let AI prepare a version and compare it with the manual one. Once the first report works, more follow quickly because the method is the same.
Conclusion
AI has long stopped doing only text. It can turn data into charts, reports, and simple dashboards, which changes reporting from costly routine into a fast basis for decisions. For companies this means earlier and better-grounded decisions without a large analytics team.
If you want to find out which of your reports can be automated first, a [free first hour of AI consultation](/en/ai-konzultacie) is a good way to assess it together.